Understanding Observability Stack with Grafana, Prometheus, Loki, and Alloy
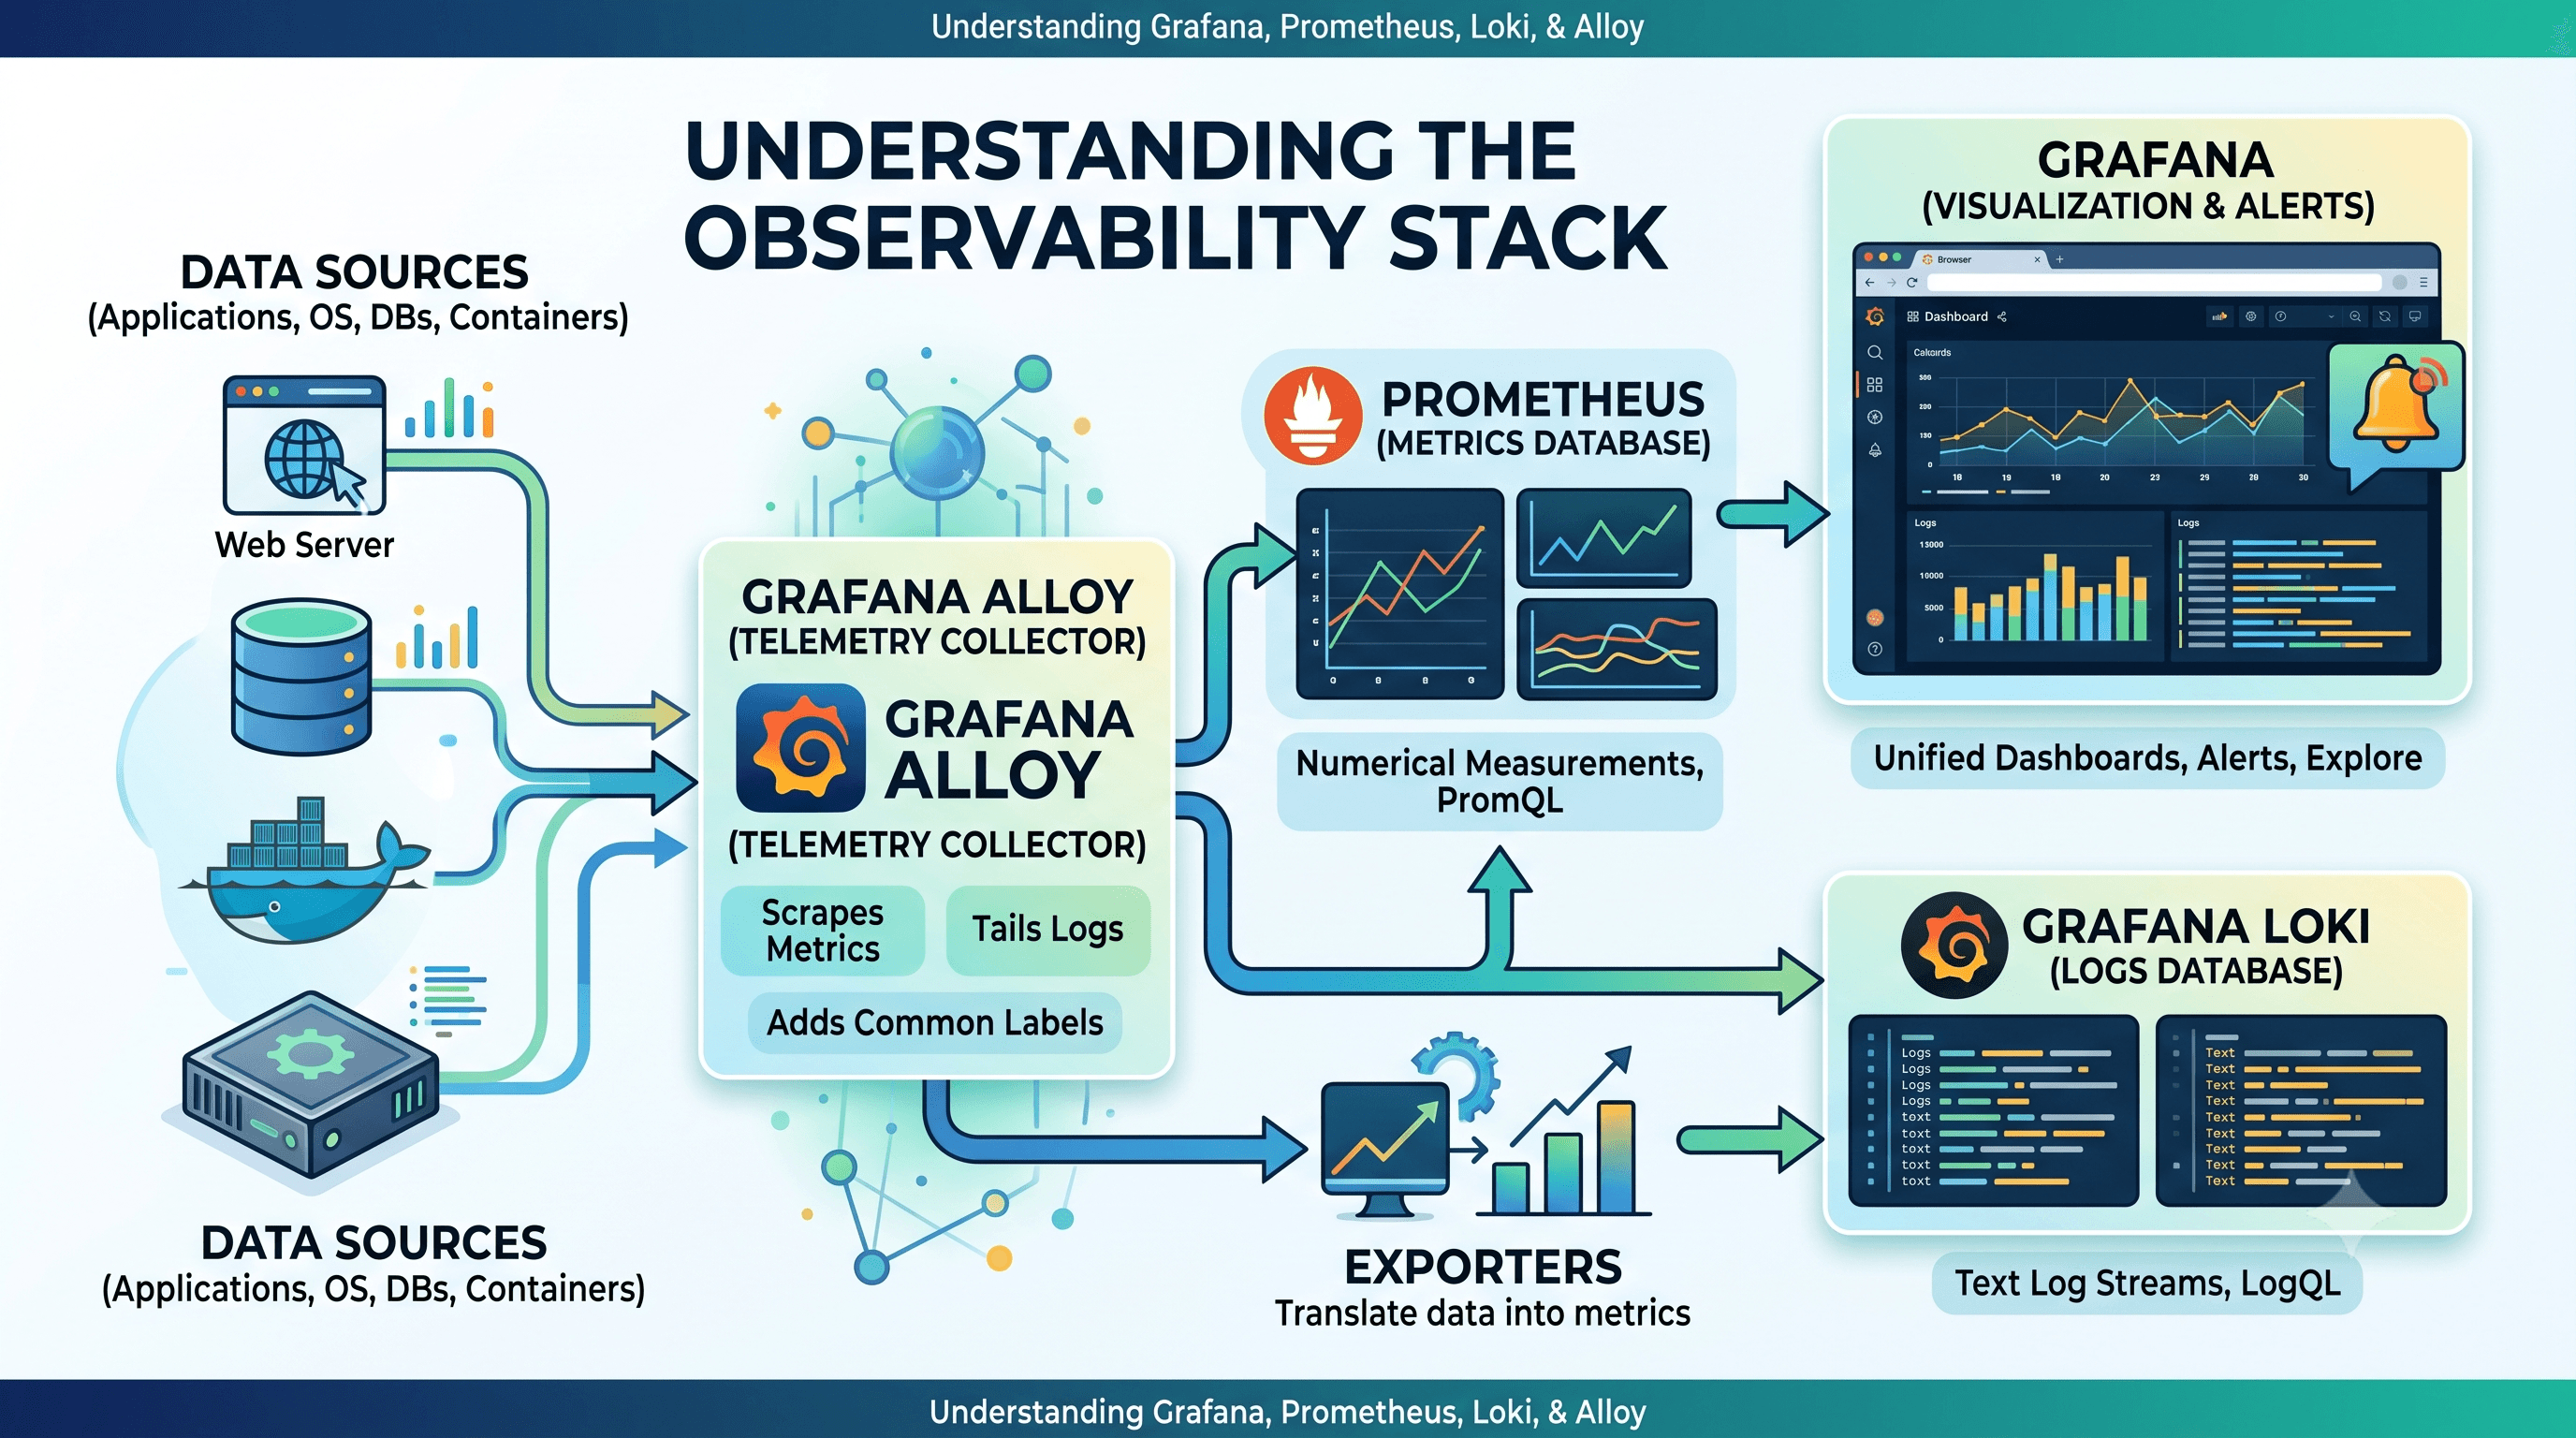
Table of Contents
- Understanding Observability Stack with Grafana, Prometheus, Loki, and Alloy
Introduction
When you deploy applications to a server, you need a reliable way to know if everything is running smoothly. This is where observability comes in.
Observability helps you answer simple but essential questions:
- Is the server running out of CPU or memory?
- How many requests per second is the API handling?
- Why did a user get an error, and what exact line in the logs explains it?
In a modern observability stack, telemetry is primarily divided into two main types of data:
- Metrics: Numerical values recorded over time (e.g., CPU usage %, memory in MB, request count, response time).
- Logs: Timestamped text messages output by applications or the operating system (e.g., error stack traces, informational events).
To collect, store, and visualize this data, we combine five core open-source components: Prometheus, Grafana Loki, Grafana, Exporters, and Grafana Alloy.
How Observability Components Fit Together
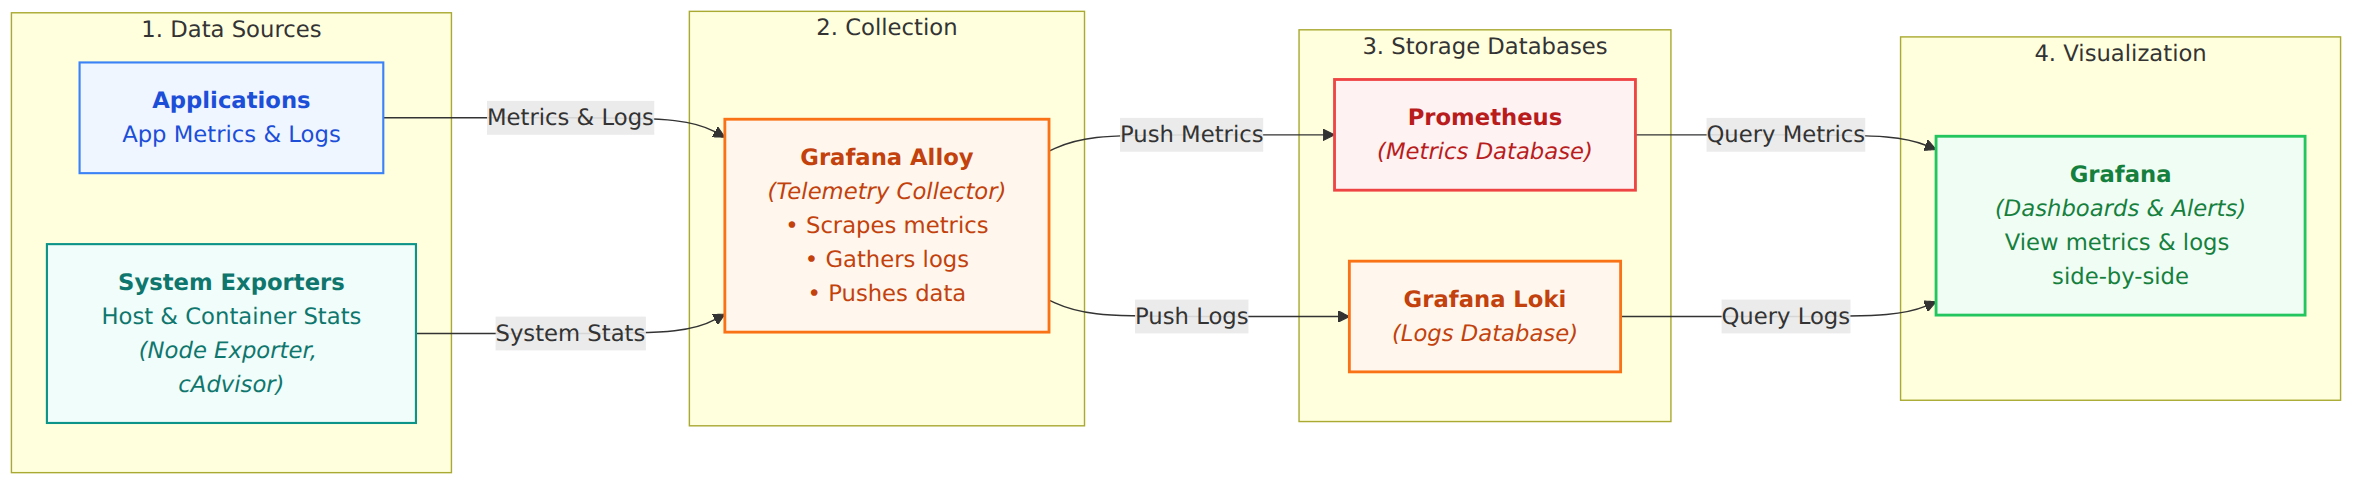
Here is a simple overview of how telemetry data moves from your applications all the way to your browser:
Simple Data Flow
- Emit Data: Applications and system exporters produce metrics and log messages.
- Collect: Grafana Alloy runs locally, gathers the metrics and logs, adds useful labels (such as
app="my-api"), and forwards them. - Store:
- Prometheus receives and stores the numerical metrics.
- Loki receives and stores the log entries.
- Visualize: Grafana connects to both Prometheus and Loki, allowing you to view graphs, inspect logs, and set up alerts on a single screen.
Core Stack Components & Their Usages
Let's break down each component and what it is used for.
1. Prometheus: Metrics Database
Prometheus is an open-source database built specifically for time-series metrics.
- What it does: Stores numbers paired with timestamps and labels.
- Example Data:
  http_requests_total{app="web", status="200"} 1540
  cpu_usage_percentage{host="server-1"} 42.5
- How you query it: Uses PromQL (Prometheus Query Language) to compute rates, averages, and totals over time:
rate(http_requests_total[5m])
- Main Usage: Measuring CPU/RAM usage, request throughput, error counts, and response latency.
2. Grafana Loki: Logs Database
Grafana Loki is an open-source log aggregation system designed by Grafana.
- What it does: Stores text log streams from all your applications and containers in one searchable place.
- Key Advantage: Unlike traditional search engines that index every single word, Loki indexes only the labels (like
app="backend",env="prod"). This makes it fast, lightweight, and very cheap on disk and memory. - How you query it: Uses LogQL to search and filter log lines:
{app="backend"} |= "error"
- Main Usage: Searching application logs, investigating exceptions, and reviewing debug traces.
3. Grafana: Dashboards & Visualization
Grafana is the web UI where you view and interact with all your monitoring data.
- What it does: Connects to data sources like Prometheus and Loki to render graphs, charts, counters, and log panels.
- Key Features:
- Unified Dashboards: Display CPU graphs, database queries, and live error logs side-by-side.
- Alerting: Sends notifications to Slack, Discord, or email when thresholds are exceeded (e.g., when CPU > 90%).
- Explore Mode: Quickly run ad-hoc queries without needing to create a permanent dashboard.
- Main Usage: The central control room for developers and operators to monitor system health.
4. Exporters: System Metric Translators
Software like Linux OS, PostgreSQL, or Redis does not natively output Prometheus metrics. Exporters act as translators: they read system stats and expose them as a /metrics page that Prometheus can read.
- Node Exporter: Measures host-level stats (OS CPU, RAM, disk space, network traffic).
- cAdvisor (Container Advisor): Measures Docker container stats (per-container CPU, RAM limits, container status).
- Database Exporters (Postgres / Redis Exporters): Measure active database connections, query throughput, and cache hit rates.
- Main Usage: Providing visibility into servers, containers, and databases without modifying their source code.
5. Grafana Alloy: Telemetry Collector
Grafana Alloy is Grafana's modern, lightweight telemetry agent.
- What it does: Runs on the server where your applications live. It gathers
/metricsfrom apps and exporters, tails log files from Docker containers, and pushes everything to Prometheus and Loki. - Why it is useful: Instead of installing separate tools for metrics and logs (like older setups with Promtail and Prometheus Agent), Alloy handles both in a single lightweight program.
- Main Usage: Local scraping, enriching data with common labels, and shipping telemetry to the databases.
Component Summary Table
Here is a quick summary of all five components:
| Component | Role | What It Does | Telemetry Type | Query Language |
|---|---|---|---|---|
| Prometheus | Metrics Database | Stores numerical measurements over time | Metrics | PromQL |
| Grafana Loki | Logs Database | Stores and indexes log streams | Logs | LogQL |
| Grafana | Visualization UI | Displays charts, graphs, and sends alerts | Dashboards & Alerts | N/A (Uses PromQL & LogQL) |
| Exporters | Metric Translators | Reads OS, Docker, and DB stats and outputs metrics | Metrics | N/A (HTTP /metrics) |
| Grafana Alloy | Telemetry Collector | Scrapes metrics and tails logs, then pushes to databases | Metrics & Logs | N/A (Agent Configuration) |
Conclusion
I hope this blog is helpful to you. Understanding these five fundamental building blocks, you can get started with modern observability. Thank you for reading.